From Text to AI-Generated Editable Visuals: How Collaboard Brings Ideas to Life
Transform processes, knowledge, concepts and data into structured visualizations that teams can understand, edit and develop together on an infinite whiteboard.
AI can generate valuable content in seconds, but long text responses are often difficult to understand and share. Discover how Collaboard and the Collaboard MCP Server turn AI-generated information into editable workflows, knowledge maps, charts and collaborative visual spaces.


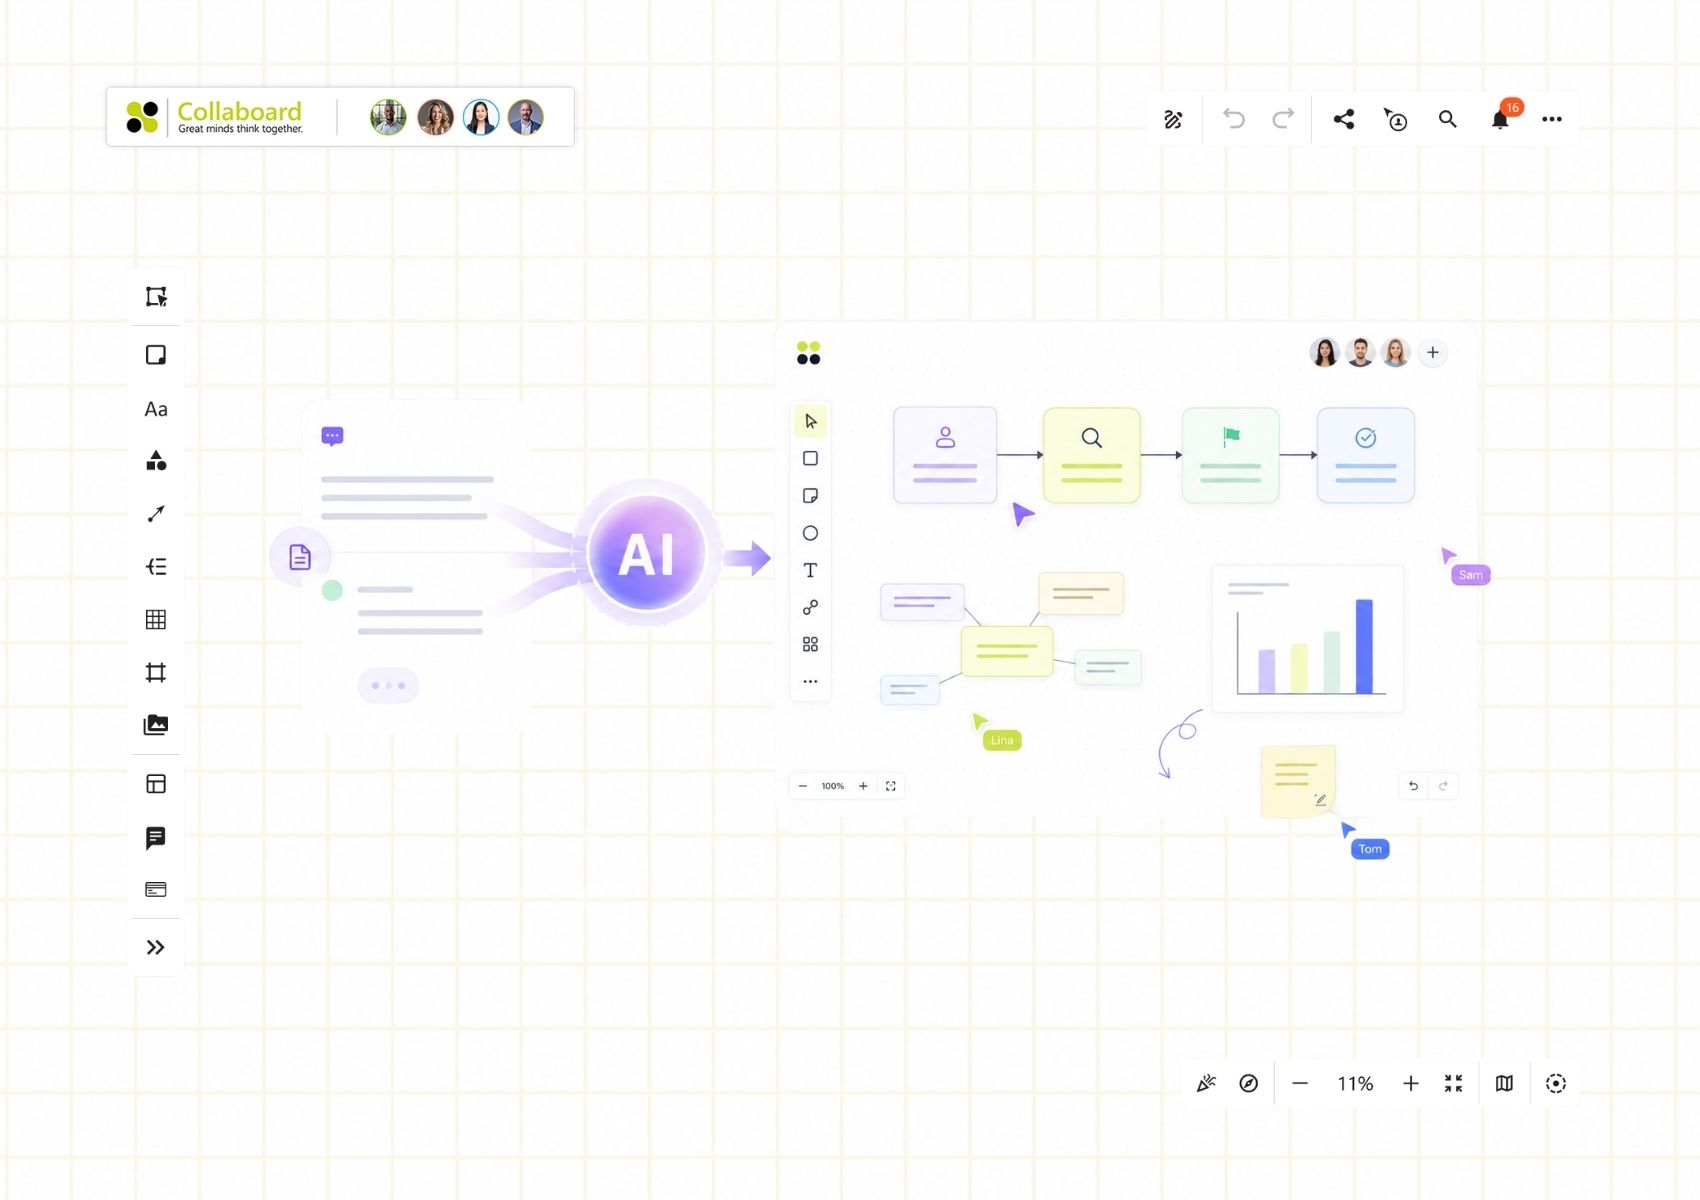

Ask an AI assistant to develop a strategy, describe a business process or summarize a complex topic, and it can generate an impressive amount of information within seconds. But the result often remains trapped inside a chat window.
The longer the response becomes, the harder it is to understand the relationships between individual ideas. Processes are hidden inside paragraphs. Dependencies are described rather than shown. Important information competes for attention with supporting details.
This is where AI-powered visualization becomes essential.
Instead of producing more text, AI can help transform information into workflows, diagrams, knowledge maps, roadmaps, charts and other visual structures.
With Collaboard, these visualizations are not static images. They become editable, shareable and collaborative working spaces.
The limitations of text-based AI
Text is an effective way to communicate detailed information. It is less effective when people need to understand how different elements relate to one another.
A process description might explain ten individual steps perfectly. But readers must still build the workflow in their own minds. They need to identify where the process starts, which decisions affect the next step and where responsibilities change.
The same challenge appears with strategies, project plans, research findings and knowledge collections. The information may be correct, but the structure is difficult to see.
AI makes it possible to generate more information than ever before. It does not automatically make that information easier to understand.
The challenge is no longer only creating knowledge. The challenge is turning knowledge into a format that people can explore, discuss and use.
AI image generation is useful, but not always enough
AI image generators have made it much easier to create illustrations, infographics and presentation visuals. A well-designed image can communicate an idea quickly and make a PowerPoint presentation more engaging.
For many situations, that is exactly what is needed.
But generated images also have limitations. They are usually static. Individual elements cannot easily be moved, edited or expanded. When information changes, the image may need to be generated again. Team members can comment on the result, but they cannot directly work with its underlying structure.
This becomes a problem when a visualization is not only meant to communicate a finished idea, but also to support the development of that idea.
Business processes evolve. Project plans change. Knowledge grows. Strategies are challenged by colleagues. Workshop results need to be reorganized after a discussion.
In these situations, a visual must be more than an image. It needs to become a working environment.
What is AI-powered visualization?
AI-powered visualization is the process of using artificial intelligence to transform text, data or other information into a visual and structured format.
For example, AI can turn a written process description into a flowchart, summarize research as a knowledge map or transform project information into a visual roadmap.
The most useful AI visualizations are not simply attractive. They help people understand relationships, identify patterns and collaborate on the information.
This is the difference between generating an image and creating an editable visualization.
From process description to editable workflow
Imagine that you have documented a customer onboarding process in a text document. The description contains responsibilities, decision points, automated actions and several possible outcomes.
A traditional AI assistant can analyze and improve the text. An image generator might create a visual interpretation of the process. But neither result is ideal when your team needs to review and change the workflow.
With Collaboard and the Collaboard MCP Server, an AI system can create the workflow directly on an online whiteboard.
The individual process steps can be represented as shapes. Connections show how information moves through the process. Decision points can create separate paths. Colors, labels and containers can distinguish roles, departments or process phases.
Most importantly, every element remains editable.
Your team can move steps, add missing information, change responsibilities and discuss improvements directly on the board. The AI-generated visualization becomes the starting point for collaboration rather than the final output.
Visualizing knowledge instead of summarizing it
AI is already widely used to summarize documents, meeting transcripts, research papers and internal knowledge. These summaries are useful, but they often flatten complex information into a linear sequence of paragraphs.
Knowledge is rarely linear.
Ideas have connections. Topics contain subtopics. Arguments support or contradict one another. Research findings relate to different business questions. Customer insights influence products, services and communication.
A whiteboard makes these relationships visible.
Collaboard can be used to organize AI-generated knowledge into clusters, maps, timelines, matrices or connected diagrams. Instead of reading a long summary from beginning to end, users can explore the information visually and focus on the areas that matter to them.
This is particularly valuable when knowledge needs to be shared with a team. A visual knowledge map gives everyone a common starting point. Team members can add context, challenge assumptions and extend the structure with their own expertise.
The result is not only a summary of existing knowledge. It becomes a shared knowledge space.
Why the infinite canvas matters
Presentations and documents have predefined boundaries. Every piece of information must fit onto a page or slide.
This can be useful when communicating a finished message. It is more restrictive when exploring a complex topic.
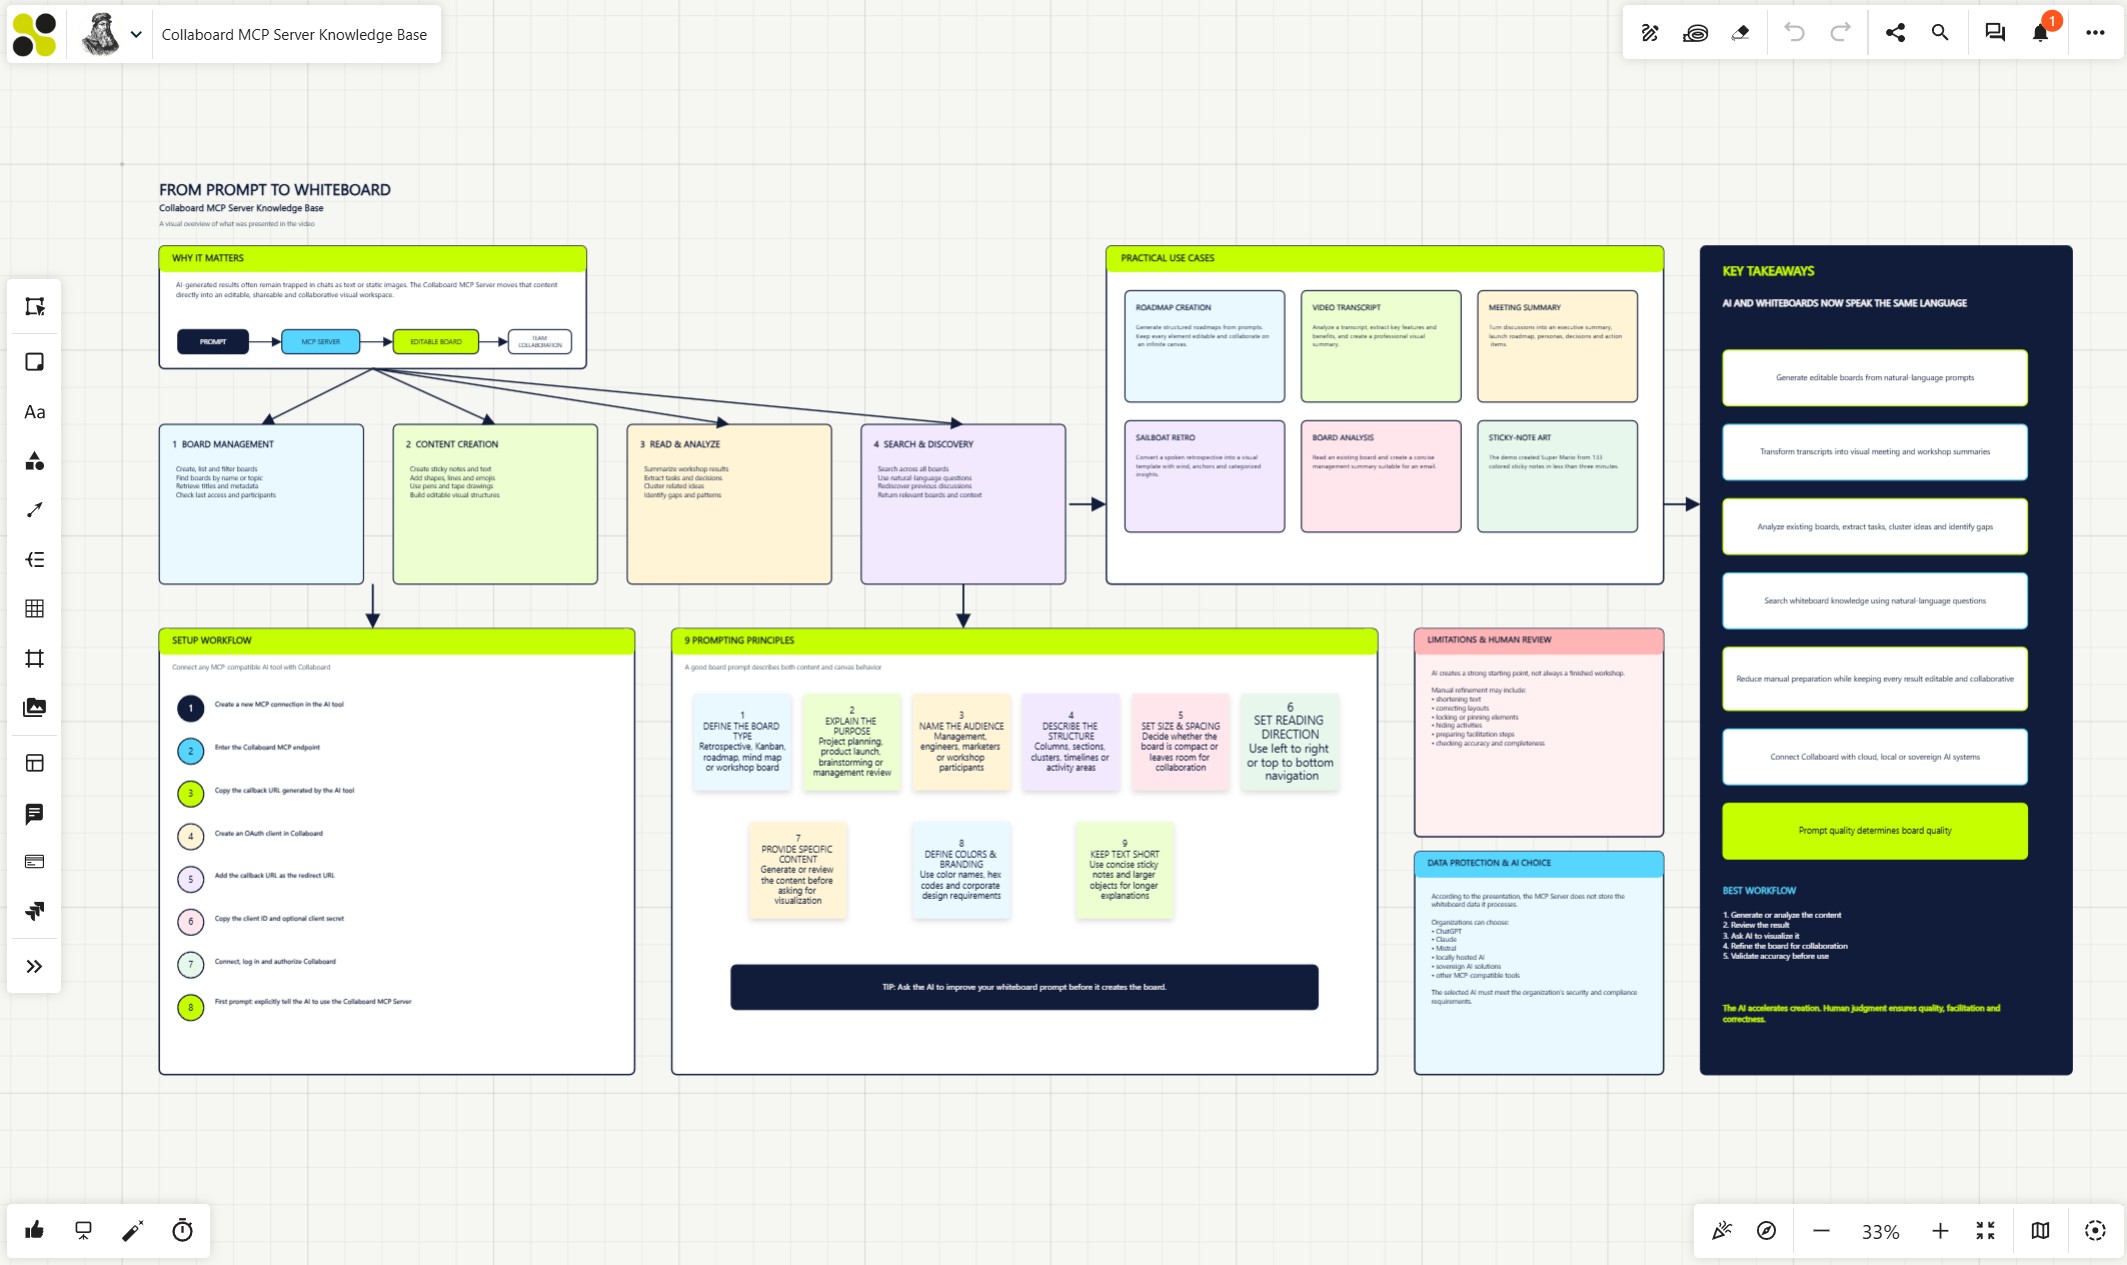
Collaboard provides an infinite canvas where visualizations can grow with the information. A simple overview can be placed next to detailed process flows, supporting research, workshop results and implementation plans.
Teams can begin with a high-level structure and gradually add more detail without splitting the work across multiple files and applications.
Frames and areas can organize the canvas into meaningful sections. Connections can remain visible even when the visualization becomes more complex. Users can move between an overview and detailed content within the same workspace.
The infinite canvas gives AI-generated content room to develop.
Connecting AI with Collaboard through the MCP Server
The Collaboard MCP Server connects compatible AI systems with Collaboard.
This allows an AI assistant to do more than describe what a board could look like. It can create and structure content directly on the whiteboard.
Based on a prompt or an existing source, the AI can generate shapes, sticky notes, text elements, connections and visual sections. It can create process diagrams, workshop boards, roadmaps, customer journeys, concept maps and knowledge visualizations.
The AI can also use information that already exists on a board. It can analyze structures, identify relationships and help reorganize content.
This creates a more natural connection between AI-generated knowledge and visual collaboration. Users no longer need to copy information from a chat, recreate it manually on a whiteboard and then format every individual element.
The distance between an idea and an editable visualization becomes much shorter.
Creating charts and data visualizations on the whiteboard
AI-powered whiteboards are not limited to sticky notes and diagrams.
Information can also be represented through bar charts, plots and other data visualizations. This makes it possible to combine qualitative and quantitative information in the same workspace.
A team could place a customer journey next to satisfaction scores, research findings and prioritized improvement ideas. A project board could combine a roadmap with resource information, risks and progress charts. A strategy visualization could include market data alongside assumptions and proposed initiatives.
Traditional charts usually appear as isolated elements inside reports or presentations. On a whiteboard, they can become part of a larger visual context.
The chart shows what is happening. The surrounding content helps the team discuss why it is happening and what should happen next.

Visualizations that continue to evolve
One of the most important benefits of an editable visualization is that it can change together with the project.
The first AI-generated version does not need to be perfect. It provides structure and reduces the effort required to begin.
From there, people contribute their experience. They correct details, add exceptions, reorganize content and adapt the visualization to their own context.
This combination is powerful. AI accelerates the creation of the first version, while people improve its relevance and accuracy through collaboration.
The visualization becomes a living business asset rather than a one-time deliverable.
From text to visual and back again
The connection between AI and a whiteboard does not need to end after the visualization has been created.
Information on the board can be analyzed and transformed back into text. A completed process diagram can become process documentation. Workshop results can be summarized into an action plan. A visual strategy can be translated into a management briefing or project proposal.
This creates a continuous workflow:
Text and data can become visual structures. Teams can collaborate on those structures. The updated information can then be extracted and reused in documents, presentations, knowledge systems and other applications.
The visualization is no longer the end of the process. It becomes a bridge between different formats and stages of work.
When should you use an AI-generated image?
AI-generated images remain an excellent option when you need a finished visual that will not require significant editing.
They are useful for illustrations, social media graphics, presentation covers and infographics that communicate a clear and stable message.
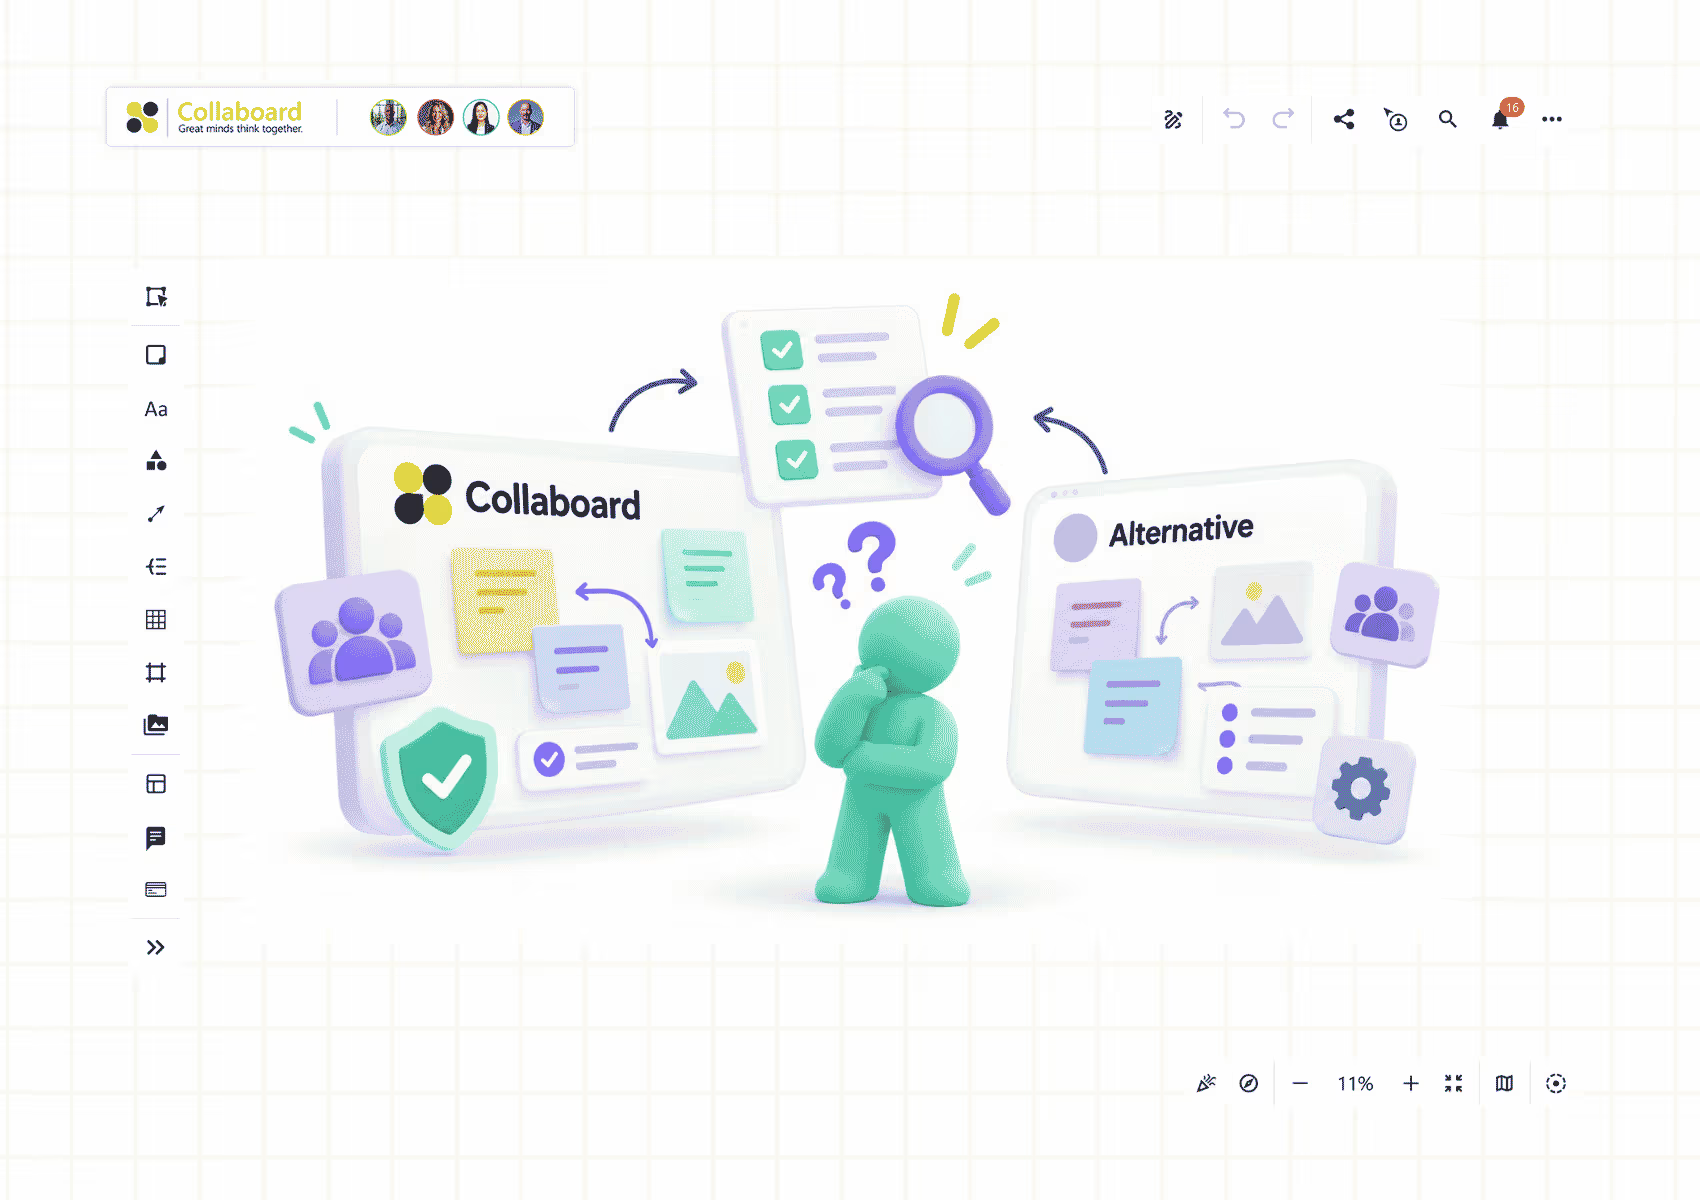
An editable whiteboard is better suited to information that still needs to be explored, discussed or developed. This includes workflows, strategies, project plans, knowledge structures, workshop results and complex concepts.
The deciding question is simple: Do people only need to look at the visualization, or do they need to work with it?
When collaboration, editing and deeper understanding are required, a visual workspace offers much more than a static image.
AI should not only generate more content
AI has dramatically increased the speed at which people can create text, images and knowledge. But speed alone does not solve the challenge of understanding complex information.
The next step is to make AI-generated knowledge easier to see, explore and improve.
Collaboard combines the capabilities of AI with the flexibility of an online whiteboard. It transforms text into editable workflows, turns knowledge into visual structures and brings charts, diagrams and collaborative content together on an infinite canvas.
Instead of receiving another long AI response, teams can create a shared visual space where ideas become clearer and knowledge becomes actionable.
Because the future of AI-powered work is not only about generating information.
It is about turning information into something people can understand and shape together.
On This Page

Start for free with Collaboard
Create your first online whiteboard, invite others and start collaborating visually.
You can use Collaboard for free and upgrade later whenever your needs grow.
*No credit card required
Michael Görög
Co-Founder Collaboard
Michael Görög is co-founder of Collaboard and is passionate about digital collaboration, visual work and the future of teamwork. He regularly shares practical insights on online whiteboards, collaboration methods, AI and new ways of turning ideas into action.

.avif)
Frequently asked questions
Any questions? We are here to help.
Yes. When an AI system is connected to a visual workspace such as Collaboard, it can create diagrams using individual shapes, text elements and connections. These elements can then be edited, moved and extended by users.
AI can analyze a written process description, identify individual steps, decisions and dependencies, and translate them into a structured workflow. In Collaboard, the resulting workflow remains editable and can be reviewed collaboratively.
An infographic is usually a static image designed to communicate a finished message. A whiteboard visualization consists of editable elements and is designed to support exploration, collaboration and continuous improvement.
Yes. AI can use available data to create visual representations such as bar charts and plots. These charts can be placed alongside diagrams, notes and other contextual information on the whiteboard.
Yes. Information from a visual board can be analyzed, summarized and reused for documentation, reports, action plans and other applications.
Subscribe to the newsletter
Stay up to date with the latest tips and news on collaboration.
Start your next whiteboard now
Get a free trial of Collaboard with up to 3 boards and five people per session. All key features are available for you to try out.