BCG Matrix Template
Sort your products or business units by market growth and market share. The BCG matrix shows where to invest, what to maintain and what to phase out.
Free to start · Swiss-made · GDPR compliant

Building a BCG matrix for your portfolio
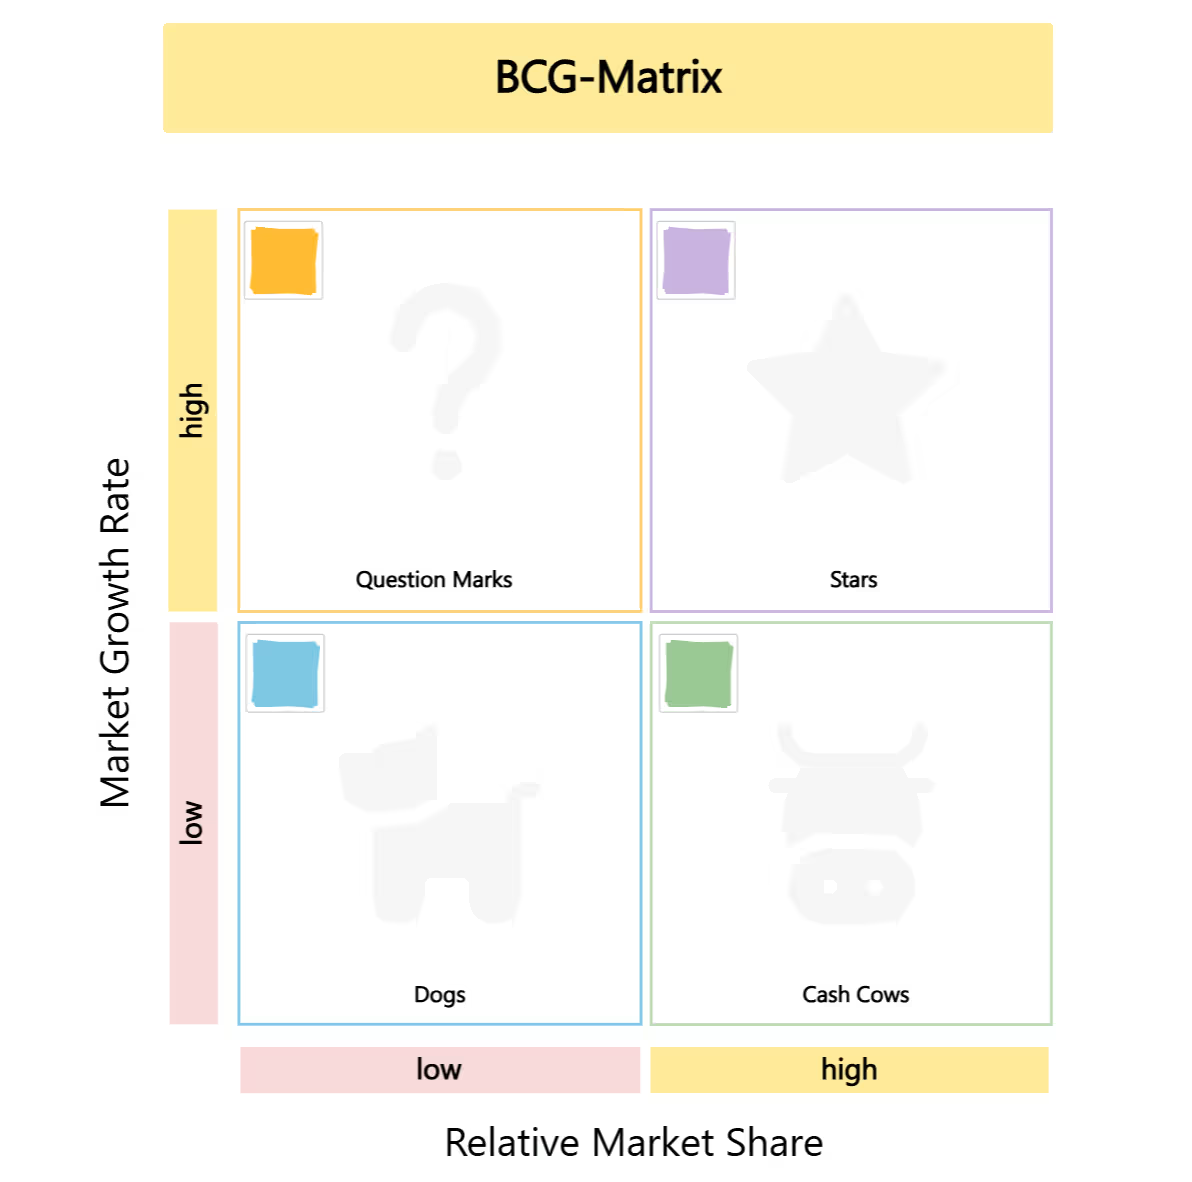
The Collaboard template shows the matrix with market growth rate on the vertical axis and relative market share on the horizontal axis. Each quadrant has its own symbol and color: orange for question marks, purple for stars, green for cash cows and light blue for dogs, each with a matching deck of notes in its corner.
List your offerings
Write each product, service or business unit on a separate note.
Gather the numbers
Collect market growth and market share for each one. Rough estimates are fine for a first round.
Place each offering
Position each note by growth and share, and use the color of the quadrant it lands in.
Discuss borderline cases
Talk about notes close to a dividing line. Small changes in the data could move them.
Decide per quadrant
Agree on a strategy: invest in stars, maintain cash cows, decide on question marks and review dogs.
Check the balance
Look at the portfolio as a whole. A healthy mix needs cash cows that fund the stars and question marks.
What is the BCG matrix?
The BCG matrix sorts the products or business units of a company by two criteria: how fast their market is growing and how large their relative market share is. The four resulting groups show where to invest, what to keep and what to give up.
The four quadrants of the template
The examples follow one illustrative scenario: a food company with several product lines.
- Question Marks: high growth, low share Promising, but uncertain. Decide whether to invest or withdraw. Example: plant-based snacks.
- Stars: high growth, high share Market leaders in growing markets. Invest to keep the lead. Example: premium coffee capsules.
- Cash Cows: low growth, high share Established products that generate money for other areas. Example: a classic breakfast cereal.
- Dogs: low growth, low share Products with little potential. Consider phasing them out. Example: canned soups in a shrinking market.
To look at the strategy behind the portfolio, the Strategy Diamond describes where and how a company competes.
Decisions a BCG matrix supports
- Portfolio reviews Get an overview of all products or business units.
- Budget planning Decide where investment brings the most.
- Strategy workshops Create a shared picture of the portfolio with management.
- Teaching Explain portfolio analysis with a well-known model.
Making BCG decisions on solid ground
- Use real data where possible Gut feeling is a start, but market figures make the discussion more solid.
- Define the market clearly Market share depends on how broadly you define the market. Agree on it first.
- Don't drop dogs automatically Some products support others or matter to key customers.
- Combine with other tools The matrix shows where things stand, not why. A SWOT analysis adds the reasons.
Why Collaboard
A Swiss-made online whiteboard for teams that care where their data lives.
Your data stays in Europe
Choose hosting in Switzerland, Germany or the EU, fully GDPR compliant. Or run Collaboard on your own servers.
Invite anyone with a link
Guests join your board for free, right in the browser. Nothing to install, no extra licenses for participants.
Made in Switzerland, with real support
Collaboard is developed in Switzerland. When you need help, you talk to people who know the product.
Frequently asked questions
Is the BCG Matrix template free?
Yes, the BCG Matrix template is free to use with a Collaboard account. The free plan includes up to 3 boards and five people per session.
What is the BCG Matrix used for?
The BCG Matrix analyzes a product portfolio by market growth and market share, to decide where to invest, what to keep and what to drop.
Who developed the BCG Matrix?
The BCG Matrix was introduced by the Boston Consulting Group in 1970.
What are cash cows in the BCG Matrix?
In the BCG Matrix, cash cows are products with a high market share in a slow-growing market. They usually need little investment and generate money for other areas.
What are the limits of the BCG Matrix?
The BCG Matrix reduces strategy to two factors. It doesn't show synergies between products or market dynamics beyond growth, so it works best together with other tools.
Start your next whiteboard now
Get a free trial of Collaboard with up to 3 boards and five people per session. All key features are available for you to try out.